
Here's a preview from my zine, The Pocket Guide to Debugging! If you want to see more comics like this, sign up for my saturday comics newsletter or browse more comics!
read the transcript!
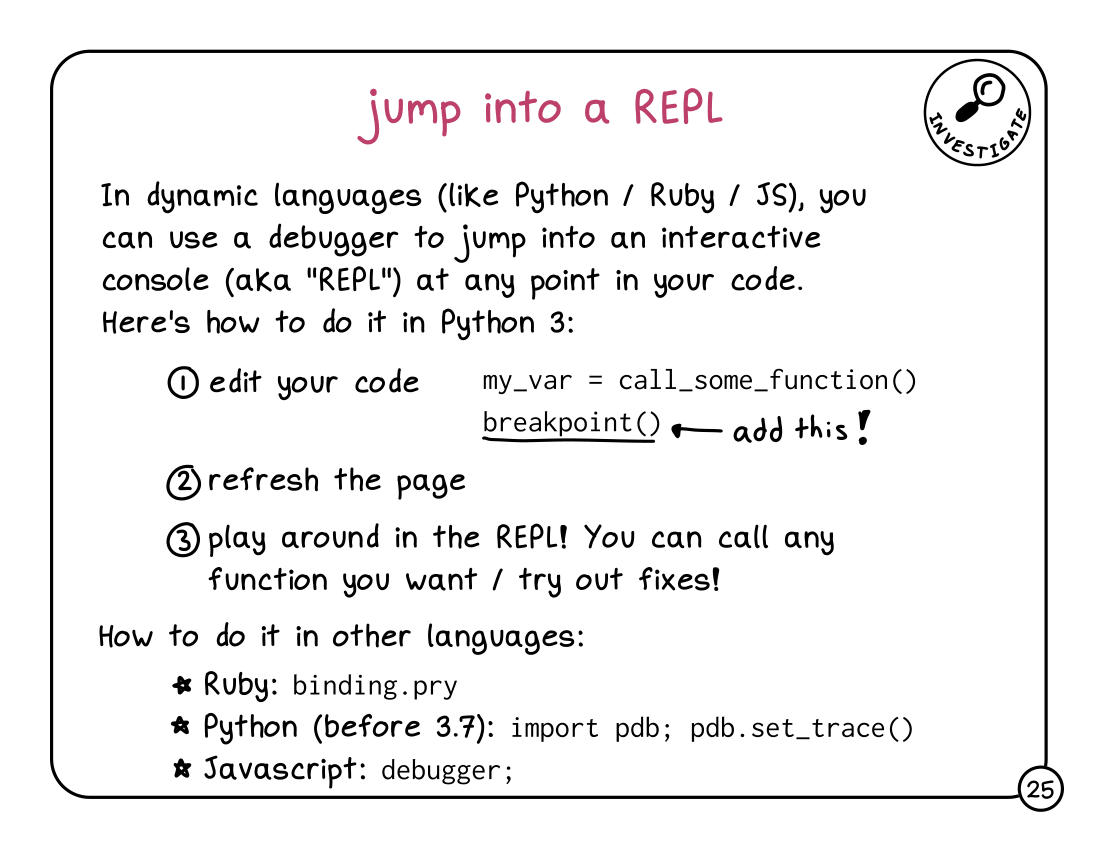
In dynamic languages (like Python / Ruby / JS), you can use a debugger to jump into an interactive console (aka “REPL”) at any point in your code.
Here’s how to do it in Python 3:
- edit your code
my_var = call_some_function() breakpoint()
add “breakpoint()”!
- rerun your code (refresh the page, whatever)
- play around in the REPL! You can call any function you want / try out fixes!
How to do it in other languages:
- Ruby:
binding.pry - Python (before 3.7):
import pdb; pdb.set_trace() - Javascript:
debugger;