
Here's a preview from my zine, Bite Size Command Line! If you want to see more comics like this, sign up for my saturday comics newsletter or browse more comics!
 get the zine!
read the transcript!
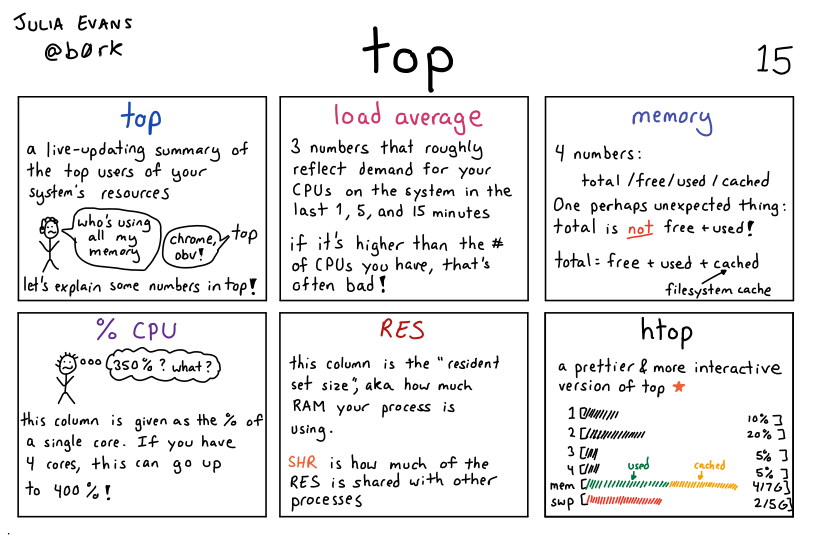
top
a live-updating summary of the top users of your system’s resources:
sad little stick person: who’s using all my memory
top: chrome, obv!
let’s explain some numbers in top!
load average
3 numbers that roughly reflect demand for your CUs on the system in the last 1, 5, and 15 minutes.
if it’s higher than the # of CPUs you have, that’s often bad!
memory
4 numbers: total/free/used/cached
One perhaps unexpected thing: total is NOT free+ used!
total = free + used + cached (filesystem cache)
% CPU
confused stick figure with hair sticking out: 350%? what?
this column is given as the % of a single core. If you have 4 cores, this can go up to 400%!
RES
this column is the “resident set size”, aka how much RAM your process is using.
SHR is how much of the RES is shared with other processes
htop
a prettier & more interactive version of top
Illustration of a graph showing different users of system resources with graphs showing used and cached memory in different colours.