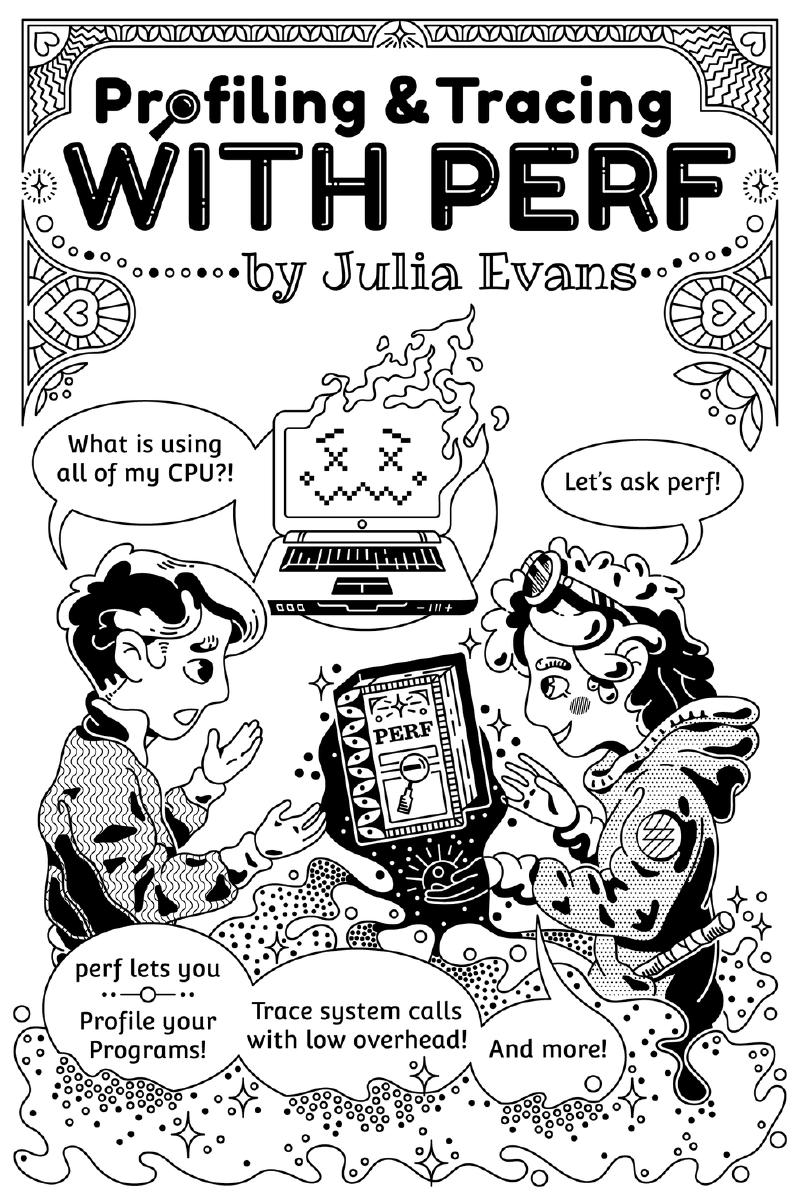
Profiling & tracing with perf
Want to get better at profiling & tracing your programs on Linux? perf is a super useful tool, but it’s fairly complicated and I found it hard to get started with. Over the last 4 years, I’ve learned a lot about how perf works, and I’ve compressed what I know into this zine for you!
You’ll learn how you can use perf to profile programs in many different programming languages (C, node.js, Java, Rust, and more!), how to count any kernel event you’re interested in (syscalls! network packets sent!), how to analyze the data that perf gives you, and more!
I want this!
Commonly asked questions:
what's a zine?
According to Wikipedia:
A fanzine (blend of fan and magazine or -zine) is a non-professional and non-official publication produced by enthusiasts of a particular cultural phenomenon (such as a literary or musical genre) for the pleasure of others who share their interest.
The zines on this site are usually about 20 pages, and they’re full of short, informative, and fun comics which will quickly teach you something useful.
who are these zines for?
They’re aimed at working programmers, like me! The idea is that you’re busy, you want to know how to use some computer thing, and the man page makes your head hurt.
is the PDF version printable?
Yes! The PDF version of the zine includes special PDFs designed to be easy printable on a home printer. Print it out, staple it, fold it, read it, and then give it to a friend! It turns out it’s way easier to convince your friends to read a physical thing that is in front of them.
They all have black & white version to make sure they print well if you only have a black & white printer.
Credits!
- Cover art by Vladimir Kašiković
- Editing by Kamal Marhubi